
J_Appl_Mater_Eng 2021, 60(2–3), 71-80; doi:10.35995/jame60020006
Selected Properties of High Entropy Alloys Based on the AlFeMnNbNiTi System
Konrad Chrzan 1,* ,
Kamil Cichocki 2,
Piotr Adamczyk 2
and
Krzysztof Muszka 2
,
Kamil Cichocki 2,
Piotr Adamczyk 2
and
Krzysztof Muszka 2
,
Kamil Cichocki 2,
Piotr Adamczyk 2
and
Krzysztof Muszka 2
1
Łukasiewicz Research Network—Krakow Institute of Technology, ul. Zakopiańska 73, 30-418 Kraków, Poland
2
AGH University of Science and Technology, al. Mickiewicza 30, 30-059 Kraków, Poland; cichocki@agh.edu.pl (K.C.); padamczyk.95@wp.pl (P.A.); muszka@agh.edu.pl (K.M.)
*
Corresponding author: konrad.chrzan@kit.lukasiewicz.gov.pl
How to cite: Chrzan, K.; Cichocki, K.; Muszka, K.; Adamczyk, P. Selected Properties of High Entropy Alloys Based on the AlFeMnNbNiTi System. J. Appl. Mater. Eng. 2020, 60(2–3), 71–80, doi:10.35995/jame60020006.
Received: 3 July 2020 / Accepted: 16 February 2021 / Published: 19 February 2021
Abstract
:The aim of this work was to study the impact of various fabrication methods used to prepare high entropy alloys based on the AlFeMnNbNiTi system. Chemical composition was customized to ensure a solid solution structure with precipitation of the Laves phase. The three manufactured alloys were prepared by melting, but with the use of various input materials and different furnaces in protective atmospheres. After the melting process, heat treatment was carried out. Structures of obtained materials were analyzed by means of a Scanning Electron Microscope (SEM) and Energy-Dispersive X-ray Spectroscopy (EDS) mapping. Mechanical properties were represented by Vickers hardness. In this paper, impact of the use of low purity input materials is shown, as well as differences in structure resulting from the utilization of different melting furnaces.
Keywords:
high entropy alloys; microstructure; hardness; SEM; EDS1. Introduction
High entropy alloys (HEAs) are a new group of materials which consist of at least five elements. According to one definition, all chemical components should be in similar concentrations. Another definition for high entropy alloys suggests that the mixing entropy for the alloy needs to be higher than 1.5R (R—gas constant, 8.314 J/(mol*K). Currently, these materials are subjected to intensive research because some of the alloys produced thus far have shown unique properties. This is influenced by the following factors:
- −
- severe lattice distortion effect affecting increase in internal stress (Guo and Liu 2011);
- −
- high entropy effect causing tendency to create solid solutions (Yeh 2013);
- −
- sluggish diffusion effect—e.g., helps maintain supersaturated state or blocks grain growth (Tong et al. 2005);
- −
- cocktail effect consisting of influence of every chemical element of the alloy on its properties (Senkov et al. 2011).
On the contrary to earlier claims about too complicated, multiphase structures of complex materials, well designed HEA alloys, even though they consist of many elements, can have single or dual phase solid solution structures such as FCC, BCC or HCP, which are in most metal alloys. Some HEAs exhibit unique properties. One example includes materials based on the Co1.5CrFeNi1.5Ti0.5 (Yeh et al. 2014) system, which exhibits excellent high temperature properties and is considered as a competitive materials for nickel based alloys. Preparing elements made of refractory high entropy alloys using special foundering methods, such as casting into multilayer molds with ceramic shells, has an influence on the material behavior under high temperatures, broadening this application (Rakoczy et al. 2019; Grudzień-Rakoczy et al. 2020). Another example is high entropy steels based on the Fe–Mn–Al–Si–C system having excellent mechanical properties in low temperatures (below 0 °C) (Raabe et al. 2015).
High entropy alloys due to their complex chemical compositions are prone to segregation (Zhang et al. 2014). In the case of manufacturing by conventional casting methods, it is recommended to remelt this type of alloy several times (Wang et al. 2009). This can decrease the inhomogeneity of ingot. To further increase the degree of homogeneity, in most cases HEA alloys are heat-treated. Homogenizing annealing is usually carried out at temperatures near to the melting temperature for relatively long time (from few hours to many days). This allows one to reach an alloy state near to the thermodynamic equilibrium state. Another important factor in manufacturing by casting and heat treatments is the protective atmosphere used in processes (Shun et al. 2010; Lin et al. 2010; Ren et al. 2012). Mostly, these treatments use a vacuum, which protects from oxidation and helps in removal of gasses from materials. Another atmosphere used for this (usually used in heat treatment) is an inert gas atmosphere, such as nitrogen or argon, which protect from reactions between alloy and atmosphere.
Except for conventional manufacturing methods, special methods such as BST—Bridgeman Solidification Casting (Qiao et al. 2008), laser cladding (Zhang et al. 2011), and mechanical alloying (Varalakshmi et al. 2008) can be used for production of HEAs. However, considering production of HEA alloys in large amounts, one should focus on adaptation of existing conventional methods and production lines to enable manufacturing of these materials.
Therefore, the current work is focused on the effect of the development strategy on mechanical behavior (hardness of the alloy) and the effect of additives on the microstructures of the HEA alloys.
2. Materials and Methods
2.1. Ingots Preparation
In total, three ingots were produced—one in a vacuum induction furnace (type VIM Lab 20-50) and two others in an electric arc furnace (Bühler AM 200) according to the data presented in Table 1. The vacuum was around 10−5–10−6 bar, and the arc furnace used high purity argon. In comparison, developed ingots showed different macrostructures, and the ingots fabricated by the vacuum induction process were porous (with high diameters of individual pores) and visible without any equipment. In this process, the alloy was melted in vacuum and cast to a ceramic crucible without unsealing of the furnace. On the other hand, the arc melted alloys developed fine structures with no visible external porosity. In this case, input materials were put into a copper crucible, where after the melting process, the alloy solidifies, forming the shape of the crucible. It is important to note that Alloy 1 was fabricated using a low purity ferroalloy; however, for Alloy 2, high purity elements were used. Alloy 3 was fabricated using ferromanganese (with a low addition of Si and C) as one input element and the other elements were pure.
Ingot produced in induction furnace weighed approximately 7 kg and had the shape of a truncated cone with a height of 90 mm and diameter from 80 mm on foot to 86 mm on spur. After melting in the arc electric furnace, the product was cuboid with a cross section of 10 × 15 mm, a length of 80 mm, and a weight of approximately 200 g.
The ingot produced in the induction furnace had some differences in color, and was visible without optic instruments (foot of ingot had another color than rest of the material).
Further, the alloys were heat-treated by homogenizing annealing in protective atmosphere (Ar) for 6 h at 900 °C. The ingots were cooled down together with a furnace by switching off the mains. Cooled ingots were cut into smaller pieces in order to prepare the samples to evaluate the hardness and microstructure using a Vickers machine and optical microscope (OM), Scanning electron Microscope (SEM) equipped with Energy Dispersive X-ray spectrometer (EDS) for chemical composition evaluation, and finally EDS X-ray mappings were carried out to observe concentration of elements across the fabricated alloys. Finally, hardness of the prepared samples was characterized using a standard Vickers machine with a load of 5 kg. Microstructural images and EDS maps were made using an FEI Nova NanoSEM 450 scanning microscope.
Specimens were cut and ground and polished using SiC papers (grit 800, 1000, 1200) and polishing clothes with diamond paste suspensions (9, 6, 3, and 1 μm) for 5 min with 150 rotations per minute using an applied force of 150 N. At the last stage, polishing was carried out with an OP-S 0.04 µm for 1 min. The prepared surface was etched in 5% natal solution. On every alloy, 4 measures were conducted and values of HV5. Hardness tests was carried out on a Tukon 2500 hardness tester.
2.2. Chemical Composition of Alloys
Chemical composition tests results using mass spectrometry are presented in Table 2. Results shows that even small additions of ferroalloy introduced many admixtures. Application of ferroalloys only also caused introduction of many additional elements.
2.3. Parameters of Fabricated Alloys
Types of HEA structures can be defined using simple calculation methods which include parameters such as (Table 3):
- −
- Entropy of configuration ΔS—should be higher than 12.471 J/(mol*K) for alloy to be considered as a high entropy alloy;
- −
- Mixing enthalpy ΔH—values between −20 a 5 kJ/mol−1 increase probability of creating a solid solution in the structure;
- −
- Ω parameter—parameters higher than 1.1 with the next parameter δ lower than 6.6 enhance chance of obtaining solid solution structure;
- −
- Valence Electron Concentration (VEC)—this parameter is helpful in determining type of solid solution structure (VEC < 6.88-BCC; 6.88 < VEC < 8-BCC + FCC; VEC > 8-FCC).
From analyzing the obtained parameters for fabricated alloys, it can be said that Alloy 2 should be treated as a multicomponent alloy with increased entropy of configuration. The rest of the parameters for this alloy suggest the creation of solid solution in the structure. Other alloys have entropies of configuration above the limit value. The parameters of Alloy 3 indicate that the material will have a BCC solid solution structure. In Alloy 1, the δ parameter is higher than 6.6, so the probability of the creation of a solid solution is lower.
2.4. Hardness
Table 4 shows hardness measurements on the studied alloys.
Hardness measurements indicate highest hardness in Alloy 1. Two other alloys have significantly lower hardness values, with the lowest being attributed to Alloy 3.
2.5. Microstructural Analysis
Figure 1 presents microstructures of studied alloys. Characteristics of the arrangement of phases are visible in bright colors in Alloys 1 and 2.
2.6. EDS Maps
Figure 2 shows maps of element distribution. For Alloy 1 and Alloy 3, distributions for admixtures which occur in large amounts are additionally shown.
EDS maps shows impact of admixtures on phase structure. The impact of silicon in Alloy 1 and Alloy 3 is especially visible. Distribution maps suggest creation of compounds in the Fe-Nb-Si-Ti system.
3. Discussion
Within the scope of this paper, the studies performed have shown that it is possible to make high entropy alloys which are melted and treated in inert gas atmospheres. In ingots, typical defects such as external porosity and basal cavities were observed as well as differences in colors between different parts of materials (this phenomenon was especially visible in Alloy 1, where the lower part of the ingot had bright-grey color and the rest was dark). This shows that in complex materials it is very difficult to achieve homogeneity at a high level in all parts of the material using standard melting processes. So, application of conventional casting methods to produce high entropy alloys such as melting induction or electric arc furnace is possible, but repeating melting several times is recommended to minimize differences in the ingot volume.
From analyzing results of hardness tests for manufactured alloys, big differences in measured hardness between materials can be seen. Alloys 2 and 3 show how important it is to use input materials which have high purities; in Alloy 3 ferromanganese introduced additional elements such as silicon and carbon into the alloy which caused a decrease in hardness. The untypical behavior of Alloy 3 is interesting because although it has a lower hardness than Alloy 2, it showed large resistance during cutting by circular saw with water cooling (cutting by this method was practically impossible). This could suggest the occurrence of the phenomenon phase transformation under high pressure (as in Hadfield steel).
Microstructures show the occurrence of a large amount of phases in manufactured alloys. It can be further noticed that in alloys made out from ferroalloys, the diversity of types of phases is the largest among produced alloys. This confirms that additional elements, even in small amounts, could have led to formation of another types of phases and increased the number of phases. The structures in the prepared alloys are complex. In the case of Alloy 1 and Alloy 2 can be seen a strong tendency for segregation, which is visible in some images where clusters were formed.
4. Conclusions
For all three chemical compositions, calculations were carried out to predict the possibility of creating solid solution structures. Most of the calculated parameters for the presented alloys suggesting creation of solid solutions in the structures. However, in all cases a large number of phases are visible. This shows that simple calculation methods of designing high entropy alloys are not always useful. Currently, better results are obtained in HEA structure predictions with thermodynamic analyses (Otto et al. 2013) or ab initio methods (Kresse and Hafner 1993; Huhn and Widom 2013).
EDS images shows how strong the impact of an application of low purity ferroalloys is in producing high entropy alloys. Although there is a small number of chemical elements that need to be introduced, they induce substantial changes in phase composition. A very good example of this is in the comparison between Alloy 2 and Alloy 3. In Alloy 2, where all of the input materials were pure, in places where is niobium, there is also iron, to a lower degree, which suggests creation of a compound between these three elements. In turn, in Alloy 3, places where there are clusters of niobium, there are also molecules of carbon, silicon and titanium. Therefore, it can be inferred that in this case, other niobium phases were formed than the ones in Alloy 2. This is caused by using ferromanganese as the input material when the rest of components were pure.
After application of heat treatment, which was conducting by annealing at 900 °C for 6 h under Ar atmosphere, characteristic clusters of some phases in Alloy 1 and Alloy 2 were observed. This arrangement could have increased fragility making cracking planes. In this case, heat treatment was relatively short (6 h). By extending annealing times and increasing annealing temperature, the level of microstructural inhomogeneity can be reduced.
In summary, complex materials require special manufacturing methods, such as several remeltings of created ingot connected with lasting annealing (He et al. 2017). In this work, ingots were remelted after being put into an arc electric furnace only two times, which could have an impact on the homogeneity level of materials. For this time, there is little information about producing this type of alloy by induction melting processes; therefore, it is hard to say how big an impact using this method to structure Alloy 1 had. Furthermore, using input materials of the appropriate purity is equally as important.
Author Contributions
Conceptualization, K.Ch., K.C., K.M. and P.A.; Methodology, K.Ch., K.C., K.M. and P.A.; Software, K.Ch., K.C., K.M. and P.A.; Validation, K.M.; Formal Analysis, K.M.; Investigation, K.Ch., K.C., K.M. and P.A.; Resources, K.Ch., K.C. and P.A.; Data Curation, K.Ch.; Writing—K.Ch.; Writing—Review and Editing, K.Ch.; Visualization, K.Ch.; Supervision, K.Ch.; Project Administration, K.M.; Funding Acquisition, K.M.
Funding
Research was financed by the Ministry of Science and Higher Education (AGH—research subsidy No. 16.16.110.663). Works connected with this article were financed by TANGO2/340100/NCBR/2017.
Acknowledgments
Special thanks go to Małgorzata Grudzień-Rakoczy and Łukasz Rakoczy who helped in preparing this paper and data analysis. We would like to also thank the people who helped in carrying out research: Marcin Kwiecień, Łukasz Lisiecki, Remigiusz Błoniarz, Paweł Drożdż and Jakub Kawałko.
Conflicts of Interest
The authors declare no conflict of interest.
References
- Grudzień-Rakoczy, M.; Rakoczy, Ł.; Cygan, R.; Kromka, F.; Pirowski, Z.; Milkovič, O. Fabrication and characterization of the newly developed superalloys based on Inconel 740. Materials 2020, 13(10), 2362. [Google Scholar] [CrossRef]
- Guo, S.; Liu, C. T. Phase stability in high entropy alloys: Formation of solid-solution phase or amorphous phase. Progress in Natural Science: Materials International 2011, 21(6), 433–46. [Google Scholar] [CrossRef]
- He, F.; Wang, Z.; Wu, Q.; Li, J.; Wang, J.; Liu, C. T. Phase separation of metastable CoCrFeNi high entropy alloy at intermediate temperatures. Scripta Materialia 2017, 126, 15–19. [Google Scholar] [CrossRef]
- Huhn, W. P.; Widom, M. Prediction of A2 to B2 phase transition in the high entropy alloy MoNbTaW. JOM 2013, 65, 1772–79. [Google Scholar] [CrossRef]
- Kresse, G.; Hafner, J. Ab initio molecular dynamics for liquid metals. Physical Review B 1993, 47, RC558–RC61. [Google Scholar] [CrossRef] [PubMed]
- Lin, C.-M.; Tsai, H.-L.; Bor, H.-Y. Effect of aging treatment on microstructure and properties of high-entropy Cu0.5CoCrFeNi alloy. Intermetallics 2010, 18(6), 1244–50. [Google Scholar] [CrossRef]
- Otto, F.; Yang, Y.; Bei, H.; George, E. P. Relative effects of enthalpy and entropy on the phase stability of equiatomic high-entropy alloys. Acta Materialia 2013, 61, 2628–38. [Google Scholar] [CrossRef]
- Qiao, J. W.; Zhang, Y.; Liaw, P. K. Tailoring microstructures and mechanical properties of Zr-based bulk metallic glass matrix composites by the Bridgman solidification. Advanced Engineering Materials 2008, 10(11), 1039–42. [Google Scholar] [CrossRef]
- Raabe, D.; Tasan, C. C.; Springer, H.; Bausch, M. From High-Entropy Alloys to High-Entropy Steels. Steel Research international 2015, 86(10), 1127–38. [Google Scholar] [CrossRef]
- Rakoczy, Ł; Grudzień-Rakoczy, M.; Cygan, R. The Influence of Shell Mold Composition on the As-cast Macro- and Micro-structure of Thin-Walled IN713C Superalloy Castings. Journal of Materials Engineering and Performance 2019, 28, 3974–85. [Google Scholar] [CrossRef]
- Ren, B.; Liu, Z. X.; Cai, B.; Wang, M. X.; Shi, L. Aging behavior of a CuCr2Fe2NiMn high-entropy alloy. Materials & Design 2012, 33, 121–26. [Google Scholar] [CrossRef]
- Senkov, O. N.; Wilks, G. B.; Scott, J. M.; Miracle, D. B. Mechanical properties of Nb25Mo25Ta25W25 and V20Nb20Mo20Ta20W20 refractory high entropy alloys. Intermetallics 2011, 19(5), 698–706. [Google Scholar] [CrossRef]
- Shun, T.-T.; Hung, C. H.; Lee, C.-F. The effects of secondary elemental Mo or Ti addition in Al0.3CoCrFeNi high-entropy alloy on age hardening at 700 °C. Journal of Alloys and Compounds 2010, 495(1), 55–58. [Google Scholar] [CrossRef]
- Tong, C. J.; Chen, Y. L.; Chen, S. K.; Yeh, J. W.; Shun, T. T.; Tsau, C. H.; Lin, S. J.; Chang, S. Y. Microstructure characterization of AlxCoCrCuFeNi high-entropy alloy system with multiprincipal elements. Metallurgical and Materials Transactions A 2005, 36, 881–93. [Google Scholar] [CrossRef]
- Varalakshmi, S.; Kamaraj, M.; Murty, B. S. Synthesis and characterization of nanocrystalline AlFeTiCrZnCu high entropy solid solution by mechanical alloying. Journal of Alloys and Compounds 2008, 460(1–2), 253–57. [Google Scholar] [CrossRef]
- Wang, F. J.; Zhang, Y.; Chen, G. L. Cooling rate and size effect on the microstructure and mechanical properties of AlCoCrFeNi high entropy alloy. Journal of Engineering Materials and Technology 2009, 131, 034501. [Google Scholar] [CrossRef]
- Yeh, J. W. Alloy design strategies and future trends in high-entropy alloys. JOM 2013, 65, 1759–71. [Google Scholar] [CrossRef]
- Yeh, A. C.; Chang, Y. J.; Tsai, C. W.; Wang, Y. C.; Yeh, J. W.; Kuo, C. M. On the solidification and phase stability of a Co-Cr-Fe-Ni-Ti high-entropy alloy. Metallurgical and Materials Transactions A 2014, 45, 184–90. [Google Scholar] [CrossRef]
- Zhang, H.; He, Y. Z.; Pan, Y.; Jiao, H. S. Microstructure and properties of 6FeCoNiCrAlTiSi high-entropy alloy coating prepared by laser cladding. Applied Surface Science 2011, 257(6), 2259–63. [Google Scholar] [CrossRef]
- Zhang, Y.; Zuo, T. T.; Tang, Z.; Gao, M. C.; Dahmen, K. A.; Liaw, P. K.; Lu, Z. P. Microstructures and properties of high-entropy alloys. Progress in Materials Science 2014, 61, 1–93. [Google Scholar] [CrossRef]
Figure 1.
Microstructures of described alloys. On the left side are pictures with magnifications 500×; on the other side, with magnifications 1000×. Types of microscope are indicated above
Figure 1.
Microstructures of described alloys. On the left side are pictures with magnifications 500×; on the other side, with magnifications 1000×. Types of microscope are indicated above
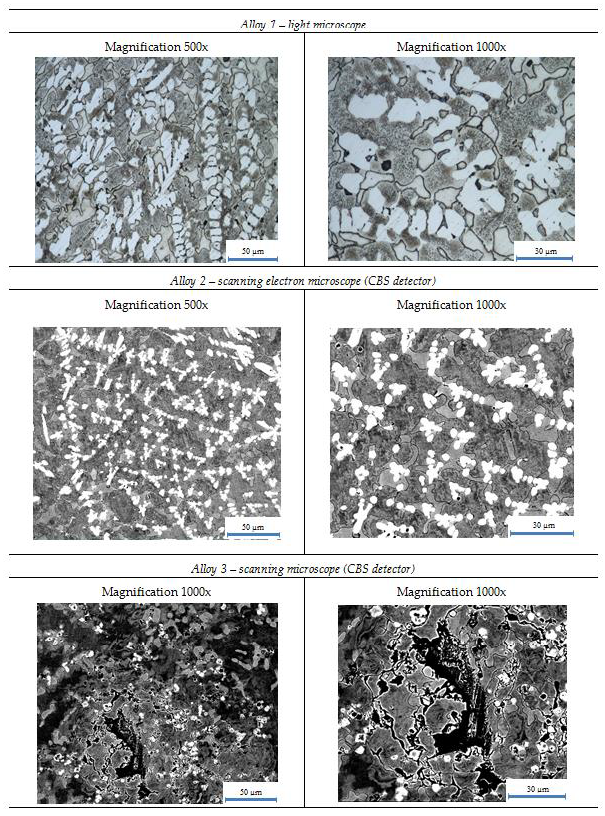
Figure 2.
Energy-Dispersive X-ray Spectroscopy (EDS) maps for sample prepared from manufactured alloys
Figure 2.
Energy-Dispersive X-ray Spectroscopy (EDS) maps for sample prepared from manufactured alloys
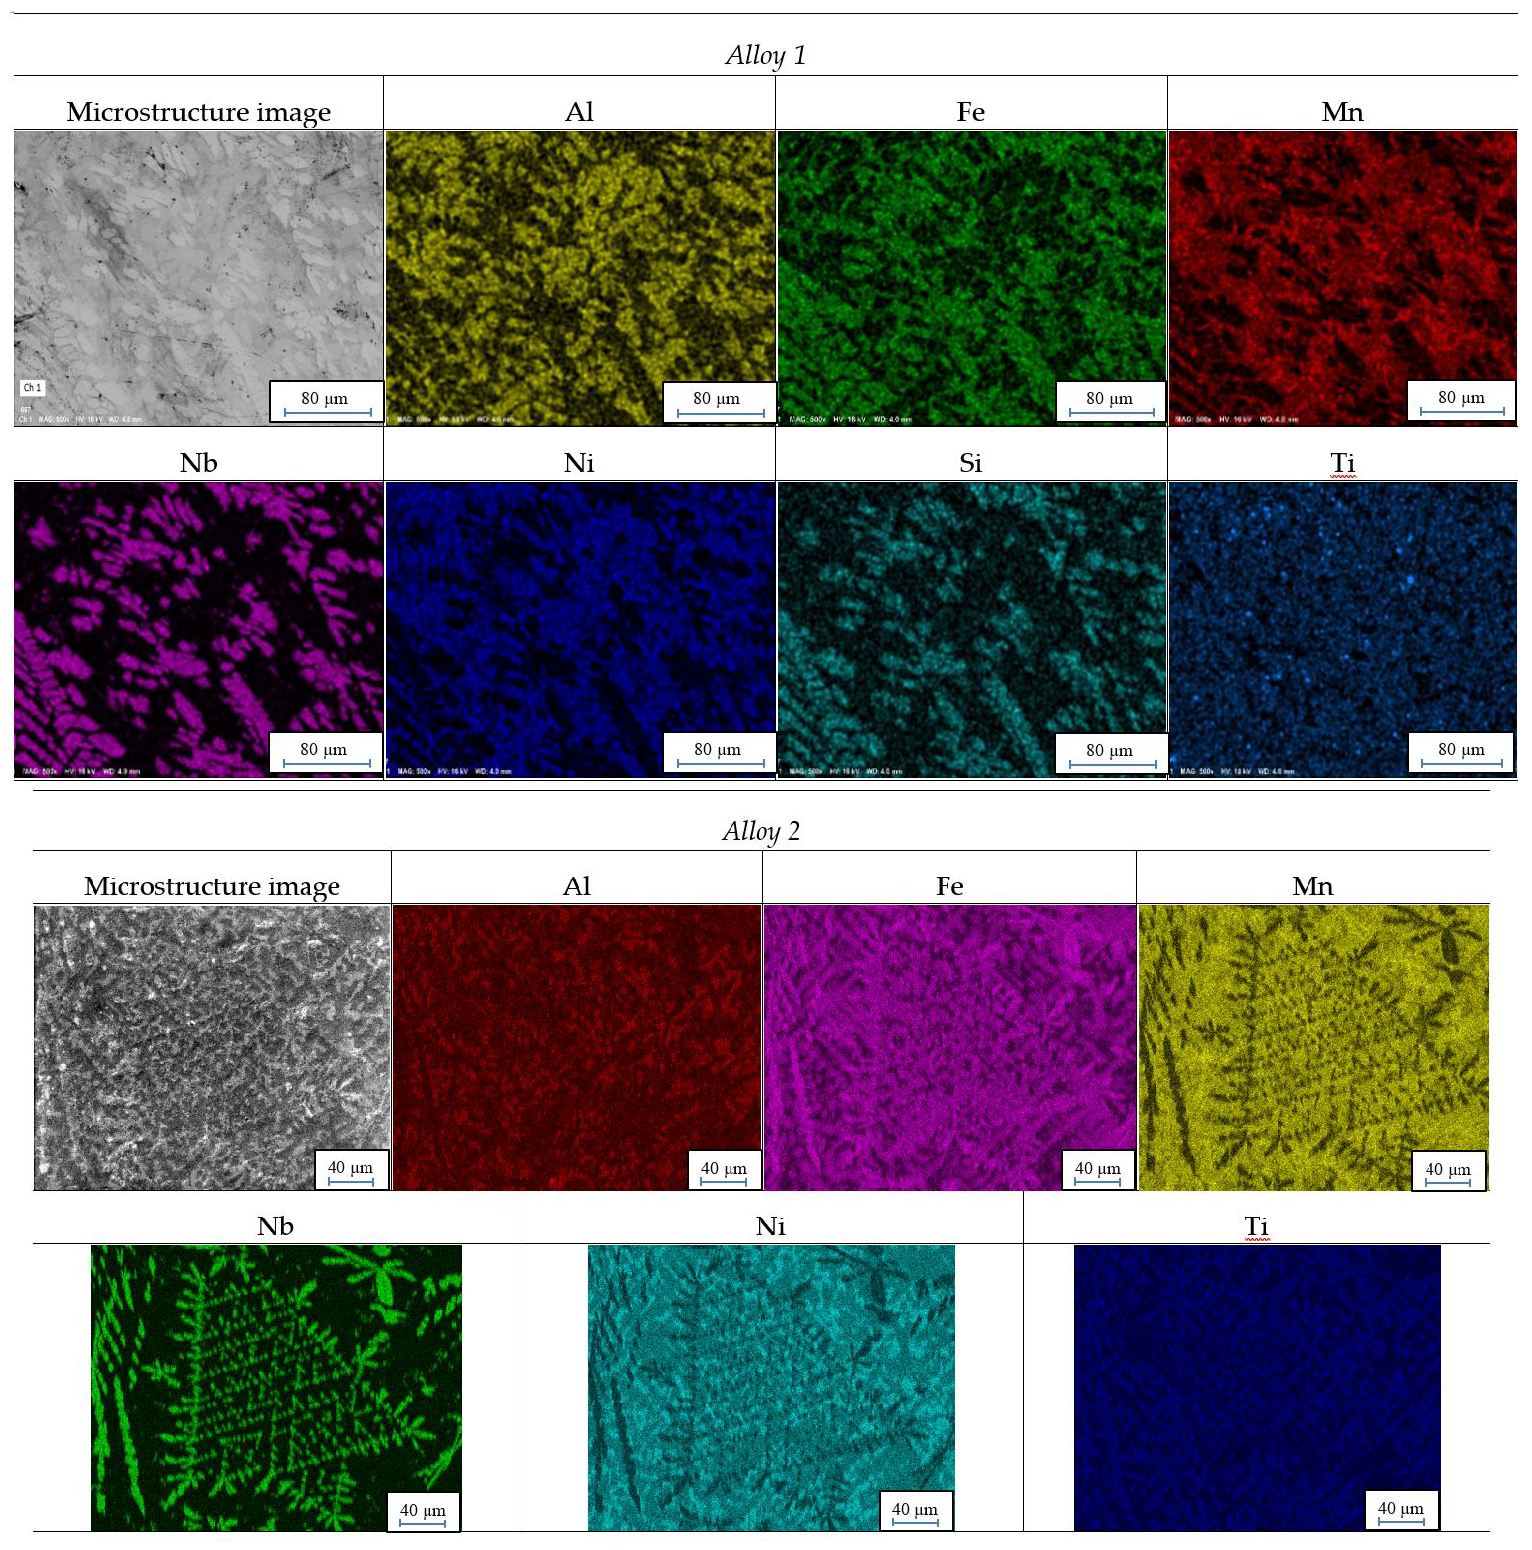
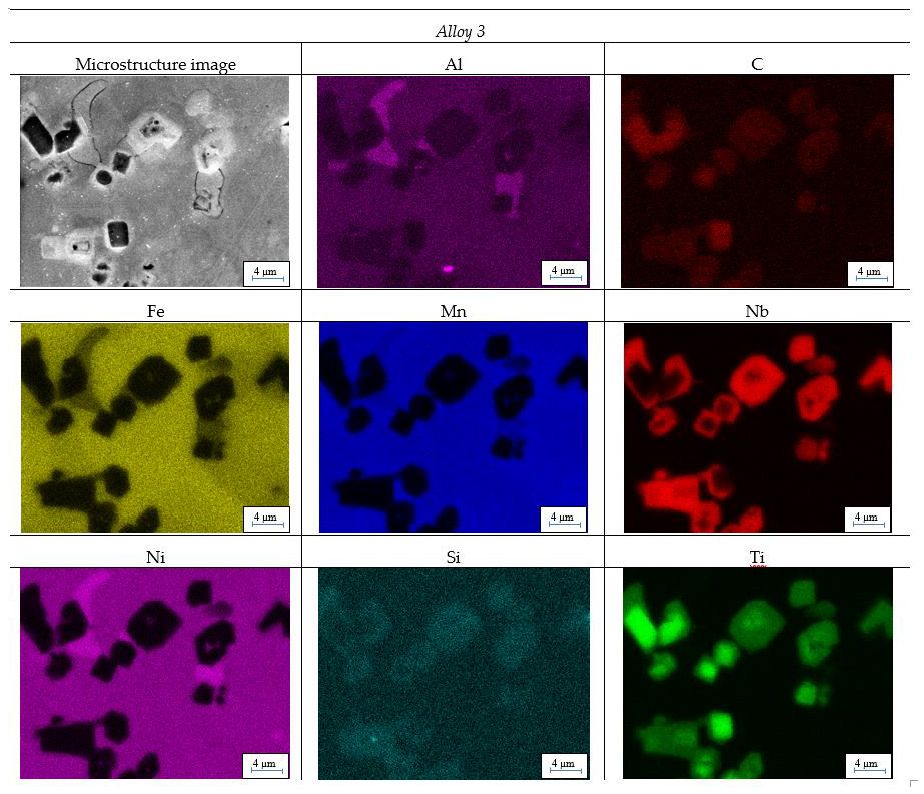

Table 1.
Methods of preparation each of alloys
| Signature | Type of Input Materials | Type of Protective Atmosphere | Melting Furnace |
|---|---|---|---|
| Alloy 1 | Ferroalloys | Vacuum | Induction furnace |
| Alloy 2 | High purity metals | Argon | Arc furnace |
| Alloy 3 | Ferroalloys | Argon | Arc furnace |
Table 2.
Chemical composition of the ingots (wt.%)
| Chemical Element | Alloy 1 | Alloy 2 | Alloy 3 |
|---|---|---|---|
| Mn | 34.60% | 40.30% | 39.50% |
| Ni | 28.50% | 28.70% | 23.90% |
| Fe | 17.50% | 18.90% | 12.40% |
| Nb | 10.20% | 6.50% | 6.60% |
| Ti | 4.20% | 2.70% | 3.40% |
| Al | 3.60% | - | 2.30% |
| Si | 0.72% | - | 0.40% |
| Zr | 0.21% | - | - |
| W | 0.20% | - | - |
| C | 0.03% | - | 1.40% |
Table 3.
Calculated parameters for tested alloys
| Alloy 1 | Alloy 2 | Alloy 3 | |
|---|---|---|---|
| ΔS [J/(mol*K)] | 13.09 | 11.64 | 12.90 |
| ΔH [kJ/mol−1] | −15.50 | −11.70 | −12.30 |
| Ω | 1.5 | 1.30 | 1.40 |
| Δ | 7.12 | 6.13 | 6.33 |
| VEC | 7.548 | 7.38 | 6.33 |
Table 4.
Hardness of each ingot
| Vickers Hardness HV 5 | ||
| Alloy 1 | Alloy 2 | Alloy 3 |
| 421 | 279 | 208 |
| 445 | 275 | 214 |
| 444 | 291 | 211 |
| 415 | 284 | 217 |
| Average | ||
| 431 | 282 | 212 |
| Standard deviation | ||
| 15.5 | 6.9 | 3.9 |
© 2021 Open Access. This article is distributed under the terms of the Creative Commons Attribution-ShareAlike 3.0 (CC BY-SA 3.0).