
J_Appl_Mater_Eng 2021, 60(4), 109-119; doi:10.35995/jame60040009
Characteristics of the Evolution of Carbide Morphology in the Haynes® 230® Alloy as a Result of High Temperature Annealing
Małgorzata Warmuzek ,
Adelajda Polkowska *
and
Tomasz Paweł Dudziak
,
Adelajda Polkowska *
and
Tomasz Paweł Dudziak
,
Adelajda Polkowska *
and
Tomasz Paweł Dudziak
Łukasiewicz Research Network—Krakow Institute of Technology, Zakopiańska 73 Str., 30-418 Kraków, Poland; malgorzata.warmuzek@kit.lukasiewicz.gov.pl (M.W.); tomasz.dudziak@kit.lukasiewicz.gov.pl (T.P.D.)
*
Corresponding author: adelajda.polkowska@kit.lukasiewicz.gov.pl
How to cite: Warmuzek, M.; Polkowska, A.; Dudziak, T.P. Characteristics of the Evolution of Carbide Morphology in the Haynes® 230® Alloy as a Result of High Temperature Annealing. J. Appl. Mater. Eng. 2020, 60(4), 109–119, doi:10.35995/jame60040009.
Received: 24 January 2021 / Accepted: 7 April 2021 / Published: 12 April 2021
Abstract
:In this work, results of an investigation of the microstructure evolution in Haynes® 230® alloy are presented. The morphological and chemical compositions of the chosen microstructure’s constituents, such as the primary and secondary carbides, were analyzed based on tests in the temperature range 700–800 °C for 1000–3000 h. The prediction of phase evolution within the microstructure was proposed based on the analysis of mutual replacement of carbide-forming elements at the carbide/matrix interface. Based on the results, some complementary markers were considered to describe Haynes® 230® microstructure evolution. Qualitative markers, i.e., defined morphological features, were related to the shape and distribution of microstructure constituents. The study also used quantitative markers related to the local chemical compositions of carbide particles, determined as the ratio of the concentrations of carbide-forming elements Crc/Wc, Crc/CrM and Wc/WM. Microstructure maps created on the basis of these complementary markers for the successive annealing stages reflected the course of its morphological evolution.
Keywords:
heat resistance; Haynes® 230®; Ni alloy; carbide; classification1. Introduction
Structural components made of nickel-based heat-resistant alloys such as Haynes® 230® are subjected to the effects of high temperature and load simultaneously during exploitation. Therefore, inevitable degradation of mechanical properties as well corrosion degradation is observed as a result of changes in the microstructure state (HAYNES International n.d.; Wu et al. 2008; Kim et al. 2014; Wang 2004; Yang et al. 2013; Dong et al. 2012; Fan et al. 2019).
The morphological model of the microstructure of Ni-based alloys can be described as grains of γ(Ni) solid solution with second-phase particles, mainly of the geometrically close-packed (GCP) group (γ’) and other phases such as the topologically close-packed (TCP) group, e.g., Laves, σ, and μ, and different carbides on grain boundaries (Dong et al. 2012; Fan et al. 2019; Belan 2016; Seiser et al. 2011; Zheng et al. 2004). As the TCP group of phases is harmful to alloy properties, their formation is usually eliminated at an early stage by selecting the chemical composition of the alloy or optimizing the heat treatment parameters (Belan 2016). Carbides of transition metals, such as Cr, W, and Mo, usually remain in the microstructure as phase constituents that control alloy properties, including its creep resistance. In the subsequent stages of microstructure shaping such as solidification, cooling, heat treatment, and exploitation, the primary carbides (e.g., MC-type) decompose while other type of carbides form through precipitation from solid solution or through phase transformations (e.g., M23C6 or M6C) (Dong et al. 2012; Belan 2016; Lvov et al. 2004; Sun et al. 2016). It is a generally accepted opinion that large particles of primary carbides can seriously degrade the mechanical properties of alloys. However, some positive material effects are also attributed to the presence of carbides, directly by participation in the matrix dispersive hardening or indirectly by stabilizing the grain boundaries against excessive shear (Dong et al. 2012; Fan et al. 2019; Belan 2016).
Recently, many procedures of identification and classifications of microstructure images based on the artificial intelligence and machine learning concepts have been developed (DeCost and Holm 2015; Ma et al. 2020; Azimi et al. 2018; Chun et al. 2020). The published results are mainly focused on extracting the features of the microstructure model. However, the microstructure of multiphase alloys consists of various constituents that differ in both morphology and chemical composition. Thus, to extract useful data on the microstructure state from its microscope images, additional local analyses of the chemical composition or crystal structure in chosen microregions should be carried out.
In this work, the main aim of the research will be to describe the morphology of carbide particles with two local features, such as shape, recognized by visual analysis and chemical composition, estimated by X-ray microanalysis. The set of the morphological patterns for carbide particles visible on the microstructure image will be defined in the natural language, based on the published knowledge on Ni-based alloys. As a second local feature, the local chemical compositions of carbide particles will be used. In order to avoid the influence of the size of the excitation zone in the X-ray point microanalysis, an adequate coefficient will be searched for, such as the ratio of the local concentration of carbide-forming elements. In this way, based on a set of visual and chemical features of carbides which result from the annealing time and temperature, it will be possible to develop maps for a specific state of the alloy microstructure.
2. Material for Examinations
The material examined was the heat-resistant Ni-based alloy Haynes® 230®; its chemical composition is shown in Table 1.
Microstructure evolution of Haynes® 230® was examined in an initial stage and after long-term exposure at temperatures of 750 and 800 °C (Table 2).
A steam experiment was carried out to evaluate microstructure changes in Haynes® 230® alloy. The research was carried out in the steam oxidation rig shown in Figure 1 (Dudziak et al. 2017a, 2017b, 2018).
In this type of steam oxidation test set-up, 100% pure steam was generated by pumping deionized water from a reservoir placed underneath the furnace. In the furnace, water steam was flown with a rate as low as 2.833 mL/min and was returned back to the reservoir. The water used in the reservoir was deionized in order to reduce number of ions dissolved in the water to a minimum. The whole system was sealed using stainless steel flanges equipped with high temperature rubber at both ends. The whole system, prior to the experimental procedure, was purged for at least 2 h using oxygen free nitrogen (OFN). This purge continued through the water reservoir throughout the sample exposure period to minimize the level of oxygen in the system. Prior to the exposure, the furnace was calibrated and set to the required temperature and the samples were placed in the “hot zone”. The calibration process ensured placement of the samples in the furnace at a test temperature with an accuracy of ±5 °C. The samples were inserted into the hot zone of the furnace using a calibrated stick at a measured distance in order to place the samples on the Al2O3 plate within the hot zone. The samples of the Haynes® 230® alloy after every interval were cooled down to room temperature naturally by switching of the mains.
Specimens for microstructure examinations were cut and mounted in the conducting resin. Microstructure observations were carried out by means of scanning electron microscope FEI SCIOS on the metallographic cross-sections, perpendicular to the exposed surface of plate, polished and chemically etched with metallographic reagents Marble and Aqua regia. The observed microregions were situated along the central axis of the cross-section.
Estimation of the local chemical composition of the chosen microregions was carried out with the EDS X-ray microanalyzer EDAX. Results analysis and ZAF correction was carried out using a commercial EDAX system TEAM v.2.2.
3. Results and Discussion
3.1. Microstructure Characterization
Microstructure of the examined alloy, Haynes® 230®, was revealed on the microscope images consisting of grains of solid solution γ(Ni)+γ’ and particles of the second phase, i.e., carbides (primary and secondary), which were inside grains and in the form of the network on grain boundaries (Figure 2, Figure 3, Figure 4, Figure 5, Figure 6 and Figure 7).
Based on the microscopic observations shown in Figure 2, Figure 3, Figure 4, Figure 5, Figure 6 and Figure 7, a morphological classification of the carbide particles was carried out. Thus, seven morphological patterns were revealed, in classes predefined in a natural language: compact/monophase, compact/two-phase (M), eutectic (E), filigree (F), dispersed particle in matrix (DM), dispersed particles on grain boundary (DG), and plate (P) (Table 3).
Then, it was possible to analyze the course of the morphological evolution of carbide particles, which occurred as a result of long-term annealing of the alloy in the form present in Table 4. One can see that some shapes of carbide particles are specific for successive stage of annealing. Two-phase compact particles, filigree, and plates only appear after annealing. Then, some of them disappear, as temperature and time of the treatment increase.
Results of the point X-ray microanalysis are presented in Table 5. The multicomponent carbides are typical for Ni-based alloys; however, this means that estimating their true composition by EDS microanalysis is difficult and the area of uncertainty can be large. The analyzed particles were not always convex and their sizes (1–10 μm) were often smaller than the estimated volume of the detection zone. The analyzed carbides particles contained, as well as the typical carbide-forming elements, Cr, W, Mo, Fe, Mn, and also Ni. At the same time, the carbide-forming elements also remained dissolved in the γ-(Ni) solid solution. Therefore, a preliminary selection of the collected set of results was used. Particles, where concentration of at least one of the carbide-forming elements was higher than in the matrix (Table 1), were selected for further analysis.
The data presented in Table 5 show that carbides with specific morphologies are characterized by a diversified and specific content of carbide-forming elements. However, in several groups of particles of similar morphology, such as eutectics E and compact monophase particles M, significant differences in chemical composition were revealed, probably affected by annealing at different temperatures. Thus, two kinds of eutectics were extracted: EP (Cr > W), the primary eutectic in specimen I, and ES (Cr < W), the secondary eutectic in specimen VI. Two groups of two-phase particles were also identified: Ta (Cr < W, in envelope) and Tb (Cr > W, in envelope).
Based on the morphology of carbide particles and their chemical compositions (Table 5), it can be assumed that the compact monophase particles with a high content of W were primary MC carbides transformed in subsequent annealing stages into M6C and M23C6 carbide particles, which is in line with the findings previously published by other scientists (Wang 2004; Yang et al. 2013; Dong et al. 2012; Lvov et al. 2004; Yin et al. 2007). The chemical compositions of the eutectic particles indicate that they formed through solidification of the residual liquid alloy (high Cr content) or melting and subsequent reaction between the carbides at the grain boundaries (high W content).
The morphology of two-phase particles T is characteristic for intermediate stage of the peritectic transformation preceded with reaction at interface of the primary carbide/matrix. They appeared after annealing at both temperatures, 750 and 800 °C. A series of peritectic and peritectoidal transformations, occurring between carbides and the alloy matrix in Ni-based alloys, are reported in the literature (Lvov et al. 2004; Sun et al. 2016). In both groups of two-phase particles, A and B, the primary phase in the center of particle can be assigned to nonstoichiometric MC1−x carbide (Wu et al. 2008; Yang et al. 2013). The results of estimation of the concentration of carbide-forming elements revealed trends of their mutual replacement between primary and peritectic phases. Then, in group A, in the secondary phase (envelope), atoms of Cr were substituted with Mo atoms and W atoms, while in group B, W and Mo atoms were substituted with Cr atoms. Therefore, in group A, the peritectic phase was formed by M6C type carbide, while in group B, the carbide M23C6 started to precipitate at the interface of the matrix. The presence of two-phase particles at all tested annealing stages may indicate that some phase transformations were incomplete, and therefore the alloy still did not reach the equilibrium state.
According to (Yang et al. 2013; Dong et al. 2012; Lvov et al. 2004), during the cooling of the alloy, the primary MC carbide becomes thermodynamically unstable below 1100 °C. It is replaced successively with M6C carbide in the temperature range 800–1100 °C. Then, the M23C6 carbide starts to form and becomes stable below 800 °C. Thus, the observed process of formation of M6C and M23C6 carbides at the expense of primary MC carbide particles indicates that during annealing of the alloy in the temperature range 750–800 °C, the phase composition of the microstructure tends to reach an equilibrium state.
The chemical compositions of the more dispersed particles, such as filigree (F), plates (Ps), and dispersed particles inside grains (DG) and decorating boundaries (DBs), were only estimated based on value of coefficient defined as concentration ratio Cr/W. The carbides forming these dispersed morphological patterns were ascribed based on the EBSD analysis of the M23C6 carbides group. The decrease in the value of the Cr/W coefficient, observed in the examined specimens (Figure 8), reflects the process of the replacement of Cr atoms with Ni atoms, reported in M23C6 carbides annealed at 750 °C (Dong et al. 2012). This process was developed for the group of dispersive carbides, in morphological patterns F, P, DG, and DB, as the annealing time was extended.
As shown in Figure 2, Figure 3, Figure 4, Figure 5, Figure 6, Figure 7 and Figure 8 and in Table 3 and Table 5, in the examined specimens at least three different classes of carbide particles were recognized:
- -
- particles of similar morphology and different chemical composition: E and M;
- -
- particles of different morphology and similar chemical composition: T, F, P;
- -
- particles of similar morphology and similar chemical composition: DG and DB.
This means that at least two different markers, morphological and chemical, are necessary to describe the microstructure image and its evolution as a result of the annealing parameters.
Usually, particle shape was described based on microscope image analysis and measured geometrical parameters using quantitative metallography rules (Romanowska-Pawliczek et al. 2011; Komenda 2001). However, very often fuzzy logic should be applied because of complication of the morphological patterns observed on microstructure images. Recently developed methods for image recognition and classification based on machine learning allow the stage of parameterization of visual characteristics to be avoided. A set of morphological patterns identified for each image can be described in the natural language and used for microstructure feature extraction by CNN procedures (Ma et al. 2020; Azimi et al. 2018; Chun et al. 2020).
The results obtained in this work can be used to characterize the microstructure image of the examined alloy with different morphological patterns of carbide particles defined in the natural language and chosen markers of their chemical compositions. Then, a microstructure map can be created to support the procedures of predicting and controlling the local damage mechanism of material and its local corrosion resistance.
Figure 9 shows an example of such a microstructure map developed on the basis of Table 3 and Table 5. It represents the location of the morphological patterns of E and T carbides in coordinates expressing their chemical compositions. The Wc/WM and Crc/CrM ratios were used as map co-ordinates (where indexes c and M are concentration in the carbide and matrix, respectively). It can be seen that, although the morphological parameters will be insufficient to recognize the two classes of eutectics, the proposed chemical compositions of additional markers will make their discrimination possible. Chemical composition of the two-phase carbide particles, especially their central area, is characteristic by similar contents of Cr and W; thus, their possible discrimination should be based on the fuzzy logic concept. Therefore, taking into account the actual chemical composition of carbide particles, it is necessary to test other chemical markers (e.g., the proportion of concentrations of other elements) that would allow for more effective differentiation of similar morphological patterns. Nevertheless, the results of this stage of the research show usefulness of the complementary parameters, morphological and chemical, to characterize evolution of carbide particles in the Ni-based alloy Haynes® 230®.
4. Conclusions
At this stage of the research, the following conclusions have been formulated:
- Morphological patterns observed in the microscope images can be ascribed to carbide particles present in the Haynes® 230® alloy at successive stages of microstructure formation during annealing. The map created on the basis of the complementary markers, morphological and chemical, reflects the course of morphological evolution of the alloy microstructure.
- Morphological patterns assigned to particles of specific carbides identified in the alloy microstructure were characteristic of the sequence of phase reactions taking place successively at the stage of solidification, cooling and, finally, annealing at the temperatures of 750 and 800 °C. In this way, these morphological taxa predefined from the microstructure image can be used by artificial intelligence-based procedures such as machine learning to control the microstructural effects generated in the Haynes® 230® nickel alloy during prolonged exposure to a high temperature.
- It was found that during the subsequent annealing stages, atoms of carbide-forming elements such as W, Mo, Cr were exchanged between the carbide particles and the matrix. The values of the relative concentrations of W, Cr and Mo were estimated on the basis of the Cr/W, Crc/CrM, Wc/WM ratios specific for each recognized morphological pattern. The phenomenon of an exchange of atoms of carbide-forming elements generates microareas of chemical heterogeneity in the matrix, which may affect the course of the solid solution strengthening process and the extent of surface corrosion.
Author Contributions
Conceptualization, W.M. and P.A.; Methodology, W.M.; Validation, W.M. and P.A. and D.T.P.; Writing—Original Draft Preparation, W.M.; Writing—Review and Editing, P.A. and D.T.P.; Funding Acquisition, W.M.
Acknowledgments
The authors wish to express thanks for support of this research by the Łukasiewicz Research Network—Krakow Institute of Technology as part of the project No. 1015/00. 2020. In addition, the authors would like to acknowledge the support of fundamental research performed in this study to National Science Centre in Poland. Project number: 2014/13/D/ST8/03256. The authors of the work also acknowledge materials supplier by Haynes International USA.
Conflicts of Interest
The authors declare no conflict of interest.
References
- Azimi, S. M.; Britz, M.; Engstler, M.; Fritz, M.; Mücklich, F. Advanced Steel Microstructural Classification by Deep Learning Methods. Scientific Reports 2018, 8, 2128. [Google Scholar] [CrossRef] [PubMed]
- Belan, J. GCP and TCP phases presented in nickel based superalloys. Material Today Proceedings 2016, 2, 936–41. [Google Scholar] [CrossRef]
- Chun, S.; Roy, S.; Nguyen, Y. T.; Choi, J. B.; Udaykumar, H. S.; Baek, S. S. Deep learning for synthetic microstructure generation in a materials by design framework for heterogeneous energetic materials. Scientific Reports 2020, 10, 13307. [Google Scholar] [CrossRef] [PubMed]
- DeCost, B.; Holm, E. A computer vision approach for automated analysis and classification of microstructural image data. Computational Materials Science 2015, 110, 126–33. [Google Scholar] [CrossRef]
- Dong, X.; Zhang, W.; Xu, Z.; Huang, H.; Ye, X.; Leng, B.; Yan, L.; Li, Z.; Zhou, X. Microstructure of carbides at grain boundaries in Nickel based super alloys. Journal of Materials Science & Technology 2012, 11, 1031–8. [Google Scholar] [CrossRef]
- Dudziak, T.; Deodeshmukh, V.; Backert, L.; Sobczak, J.; Witkowska, M.; Ratuszek, W.; Chruściel, K.; Zieliński, A.; Sobczak, N.; Bruzda, G. Phase Investigations under Steam Oxidation Process at 800 °C for 1000 h of Advanced Steels and Ni-Based Alloys. Oxidation of Metals 2017a, 87, 139–58. [Google Scholar] [CrossRef]
- Dudziak, T.; Boroń, L.; Deodeshmukh, V.; Sobczak, J.; Sobczak, N.; Witkowska, M.; Ratuszek, W.; Chruściel, K. Steam oxidation behaviour of advanced steels and Ni based alloys at 800 °C. Journal of Materials Engineering and Performance 2017b, 26, 1044–56. [Google Scholar] [CrossRef]
- Dudziak, T.; Gajewski, P.; Śnieżyński, B.; Deodeshmukh, V.; Witkowska, M.; Ratuszek, W.; Chruściel, K. Neural Network Modelling Studies of Steam Oxidised Kinetic Behaviour of Advanced Steels and Ni-based alloys at 800 °C for 3000 hours. Corrosion Science 2018, 133, 94–111. [Google Scholar] [CrossRef]
- Fan, Y.; Huang, W.; Yang, X.; Shi, D.; Lia, S. Mechanical properties deterioration and its relationship with microstructural variation using small coupons sampled from serviced turbine blades. Materials Science & Engineering A 2019, 757, 134–45. [Google Scholar]
- High Temperature Alloys. Haynes 230 Alloy. Tensile Properties. Available online: https://www.haynesintl.com/alloys/alloy-portfolio_/High-temperature-Alloys/HAYNES-230-ALLOY.aspx (accessed on 5 April 2021).
- Kim, I. S.; Choi, B. G.; Hong, H. U.; Do, J.; Jo, C. Y. Influence of thermal exposure on the microstructural evolution and mechanical properties of a wrought Ni-base superalloy. Materials Science and Engineering: A 2014, 593, 55–63. [Google Scholar] [CrossRef]
- Komenda, J. Automatic recognition of complex microstructures using the Image Classifier. Materials Characterization 2001, 46, 87–92. [Google Scholar] [CrossRef]
- Lvov, G.; Levit, V. I.; Kaufman, M. J. Mechanism of Primary MC Carbide Decomposition in Ni-Base Superalloys. Metallurgical and Materials Transaction A 2004, 35A, 1669–79. [Google Scholar] [CrossRef]
- Ma, W.; Kautz, E. J.; Baskaran, A.; Chowdhury, A.; Joshi, V.; Yener, B.; Lewis, D. J. Image-driven discriminative and generative machine learning algorithms for establishing microstructure–processing relationships. Journal of Applied Physics 2020, 128, 134901. [Google Scholar] [CrossRef]
- Romanowska-Pawliczek, A.; Siwek, A.; Głowacki, M.; Warmuzek, M. Image recognition, identification and classification algorithms in cast alloys microstructure analysis. In Proceedings of the IMETI 2011: 4th International Multi-Conference On Engineering and Technological Innovation, Orlando, FL, USA, July 19–22; Callaos, N., Carrasquero, J. V., Chu, H.-W., Ferrer, J., Savoie, M. J., Tremente, A., Eds.; 2011; Vol. II, pp. 56–61. [Google Scholar]
- Seiser, B.; Drautz, R.; Pettifor, D. G. TCP phase predictions in Ni-based superalloys: Structure maps revisited. Acta Materialia 2011, 59, 749–63. [Google Scholar] [CrossRef]
- Sun, W.; Qin, X.; Guo, J.; Lou, L.; Zho, L. Degeneration Process and Mechanism of Primary MC Carbides in a Cast Ni-Based Superalloy. Acta Metallurgica Sinica 2016, 52, 455–62. [Google Scholar] [CrossRef]
- Wang, T. Database development and microstructure modeling in Ni-base superalloys. Acta Materialia 2004, 52, 2837–45. [Google Scholar]
- Wu, Q.; Song, H.; Swindeman, R. W.; Shingledecker, J. P.; Vasudevan, V. K. Microstructure of long-term aged IN617 Ni-base superalloy. Metallurgical and Materials Transactions A 2008, 39, 2569–85. [Google Scholar] [CrossRef]
- Yang, Y.; Thomson, R. C.; Leese, R. M.; Roberts, S. Microstructural evolution in cast Haynes 282 for application in advanced power plants. In Advances in Materials Technology for Fossil Power Plants, Proceedings of the Seventh International Conference, Waikoloa, HI, USA, October 22–25; Gandy, D., Shingledecker, J., Eds.; ASM International: Waikoloa, 2013. [Google Scholar]
- Yin, F. S.; Zheng, Q.; Sun, X. F. Effect of melt treatment on carbides formation in a cast nickel based superalloy M963. Journal of Materials Processing Technology 2007, 183, 440–44. [Google Scholar] [CrossRef]
- Zheng, Y.; Li, S.; Zheng, L.; Han, Y. Abnormal Phases in High Content Nickel Based Superalloys and Phase Control; Green, K. A., Pollock, T. M., Harada, H., Howson, T. E., Reed, R. C., Schirra, J. J., Walston, S., Eds.; 2004; TMS (The Minerals, Metals & Materials Society). [Google Scholar]
Figure 1.
Atmospheric steam oxidation test facility used in the work
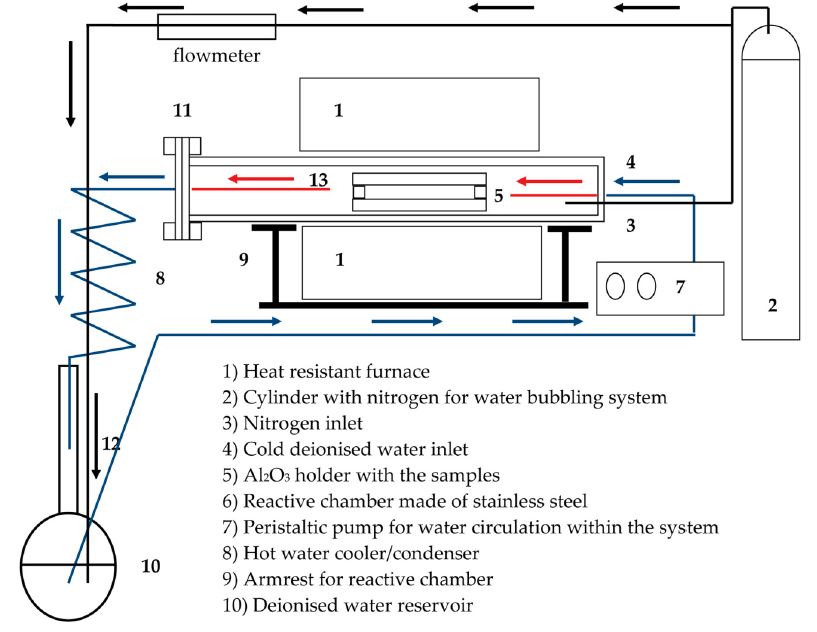
Figure 2.
Specimen I. Microstructure of the examined alloy in the initial state and metallographic cross-section, etched with Aqua Regia, SEM, SE: (a) microscopic mag., 1000×; (b) microscopic mag., 8000×; (c) microscopic mag., 8000×
Figure 2.
Specimen I. Microstructure of the examined alloy in the initial state and metallographic cross-section, etched with Aqua Regia, SEM, SE: (a) microscopic mag., 1000×; (b) microscopic mag., 8000×; (c) microscopic mag., 8000×
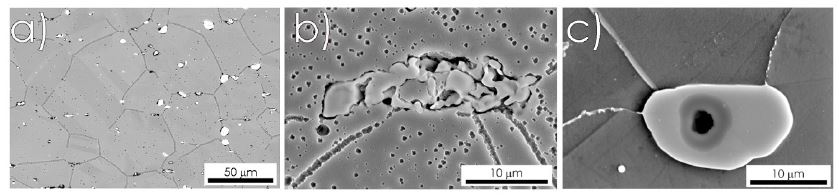
Figure 3.
Specimen II. Microstructure of the examined alloy after annealing 1000 h/750 °C and metallographic cross-section, etched with Aqua Regia, SEM, SE: (a) microscopic mag., 5000×; (b) microscopic mag., 10,000×; (c) microscopic mag., 15,000×
Figure 3.
Specimen II. Microstructure of the examined alloy after annealing 1000 h/750 °C and metallographic cross-section, etched with Aqua Regia, SEM, SE: (a) microscopic mag., 5000×; (b) microscopic mag., 10,000×; (c) microscopic mag., 15,000×
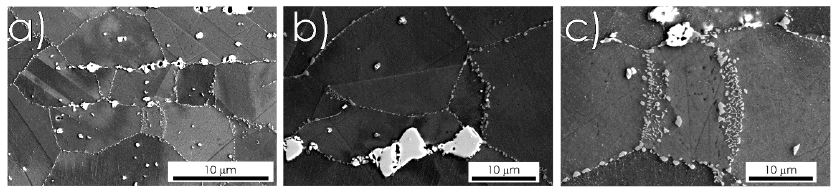
Figure 4.
Specimen III. Microstructure of the examined alloy after annealing 2000 h/750 °C and metallographic cross-section, etched with Aqua Regia, SEM, SE: (a) microscopic mag., 5000×; (b) microscopic mag., 10,000×; (c) microscopic mag., 15,000×
Figure 4.
Specimen III. Microstructure of the examined alloy after annealing 2000 h/750 °C and metallographic cross-section, etched with Aqua Regia, SEM, SE: (a) microscopic mag., 5000×; (b) microscopic mag., 10,000×; (c) microscopic mag., 15,000×
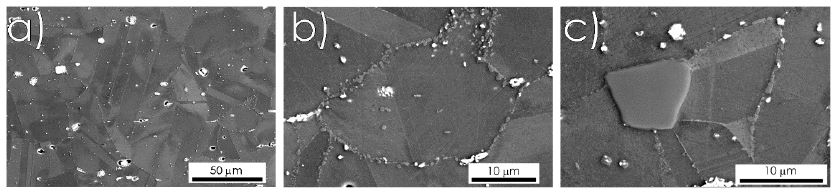
Figure 5.
Specimen IV. Microstructure of the examined alloy after annealing 3000 h/750 °C and metallographic cross-section, etched with Aqua Regia, SEM, SE: (a) microscopic mag., 5000×; (b) microscopic mag., 10,000×; (c) microscopic mag., 15,000×
Figure 5.
Specimen IV. Microstructure of the examined alloy after annealing 3000 h/750 °C and metallographic cross-section, etched with Aqua Regia, SEM, SE: (a) microscopic mag., 5000×; (b) microscopic mag., 10,000×; (c) microscopic mag., 15,000×
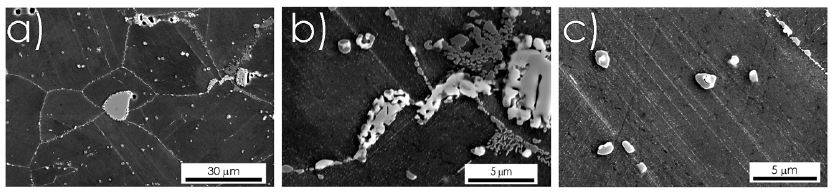
Figure 6.
Specimen V. Microstructure of the examined alloy after annealing 1000 h/800 °C and metallographic cross-section, etched with Aqua Regia, SEM, SE: (a) microscopic mag., 2000×; (b) microscopic mag., 15,000×, (c) microscopic mag., 25,000×
Figure 6.
Specimen V. Microstructure of the examined alloy after annealing 1000 h/800 °C and metallographic cross-section, etched with Aqua Regia, SEM, SE: (a) microscopic mag., 2000×; (b) microscopic mag., 15,000×, (c) microscopic mag., 25,000×
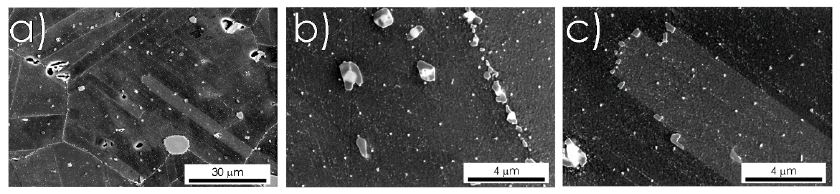
Figure 7.
Specimen VI. Microstructure of the examined alloy after annealing 2000 h/800 °C and metallographic cross-section, etched with Aqua Regia, SEM, SE: (a) microscopic mag., 1000×; (b) microscopic mag., 10,000×; (c) microscopic mag., 15,000×
Figure 7.
Specimen VI. Microstructure of the examined alloy after annealing 2000 h/800 °C and metallographic cross-section, etched with Aqua Regia, SEM, SE: (a) microscopic mag., 1000×; (b) microscopic mag., 10,000×; (c) microscopic mag., 15,000×
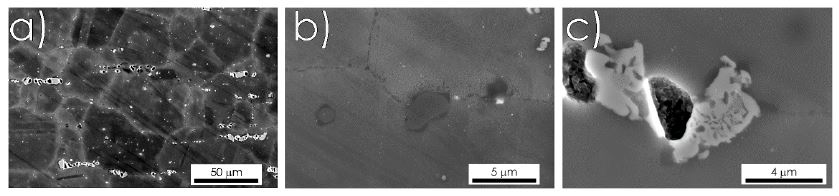
Figure 8.
Concentration ratio Cr/W for predefined morphological patterns of carbides in specimens annealed at 750 °C
Figure 8.
Concentration ratio Cr/W for predefined morphological patterns of carbides in specimens annealed at 750 °C
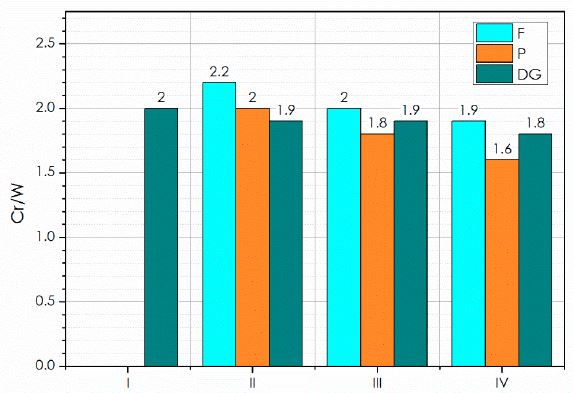
Figure 9.
Microstructure map, presenting morphological patterns related to chemical composition coefficients Wc/WM and Crc/CrM of carbide particles of eutectic E and two-phase Ta and Tb groups
Figure 9.
Microstructure map, presenting morphological patterns related to chemical composition coefficients Wc/WM and Crc/CrM of carbide particles of eutectic E and two-phase Ta and Tb groups
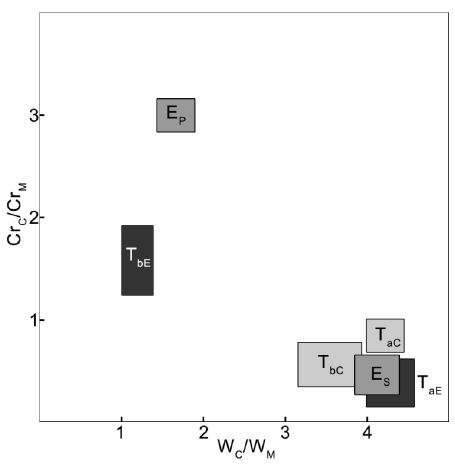

Table 1.
Chemical composition of the examined alloy Haynes® 230® (weight %)
| Ni | Cr | W | Mo | Fe | Co | Mn | Si | Al | Ti | C | La | B |
|---|---|---|---|---|---|---|---|---|---|---|---|---|
| Bal. | 22 | 14 | 2 | 3 | 5 | 0.5 | 0.4 | 0.3 | 0.1 | 0.1 | 0.02 | 0.015 |
Table 2.
Annealing condition of the examined alloy, Haynes® 230®
| No of Specimen | State of Plastic Deformation | Annealing Time | Annealing Temperature |
|---|---|---|---|
| I | Initial commercial state | Initial commercial state | Initial commercial state |
| II | As initial | 1000 h | 750 °C |
| III | As initial | 2000 h | 750 °C |
| IV | As initial | 3000 h | 750 °C |
| V | As initial | 1000 h | 800 °C |
| VI | As initial | 2000 h | 800 °C |
Table 3.
Morphological patterns of the second-phase particles, i.e., carbides, revealed in the examined specimens
Table 3.
Morphological patterns of the second-phase particles, i.e., carbides, revealed in the examined specimens
| Taxon of Morphological Pattern | Typical Pattern Recognized on the Microstructure Image | Taxon of Morphological Pattern | Typical Pattern Recognized on the Microstructure Image |
|---|---|---|---|
| 1. Compact/ monophase M |  | 2. Compact/ two-phase T | 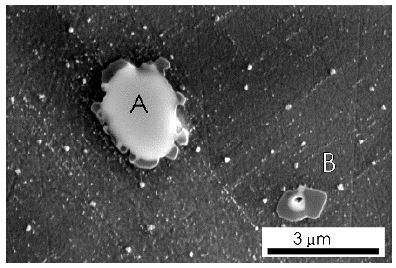 |
| 3. Eutectic E |  | 4. Filigree F | 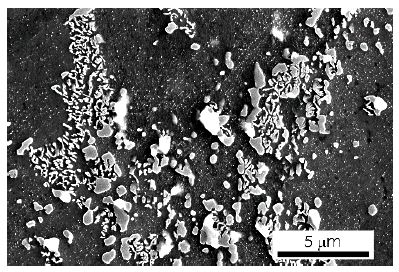 |
| 5. Dispersed particles in matrix DM | 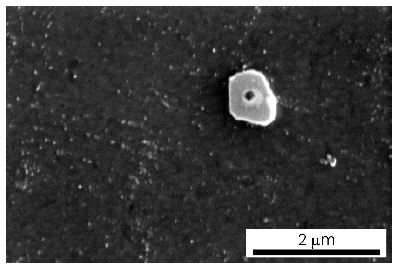 | 6. Dispersed particles on grain boundary DG | 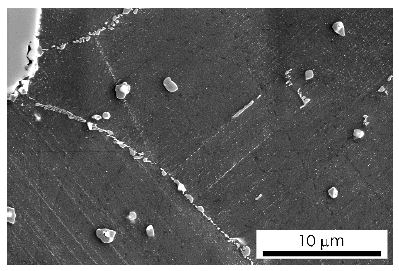 |
| 7. Plate P | 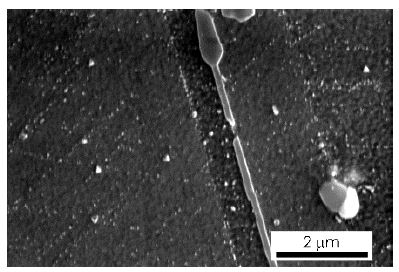 | ||
Table 4.
Morphology of the carbide particles observed in the examined particles in Haynes® 230®
| Morphological Pattern | No. of Specimen | |||||
|---|---|---|---|---|---|---|
| I | II | III | IV | V | VI | |
| E | X | X | ||||
| M | X | X | X | X | X | X |
| T | X | X | X | X | X | |
| F | X | X | X | X | ||
| DM | X | X | X | X | ||
| DG | X | X | X | X | X | X |
| P | X | X | X | X | ||
Table 5.
Estimated concentration of carbide-forming elements in the chosen predefined particles of carbides
Table 5.
Estimated concentration of carbide-forming elements in the chosen predefined particles of carbides
| No. of Specimen | Eutectic | Compact Monophase M | Compact Two-Phase A Ta | Compact Two-Phase B Tb | ||||||||||||||
|---|---|---|---|---|---|---|---|---|---|---|---|---|---|---|---|---|---|---|
| Cr | Mo | W | Cr | Mo | W | Center TC | Envelope TE | Center TC | Envelope TE | |||||||||
| Cr | Mo | W | Cr | Mo | W | Cr | Mo | W | Cr | Mo | W | |||||||
| I | 66 | 2 | 22 | 16 | 4 | 57 | ||||||||||||
| II | 17 | 3 | 56 | 18 | 3 | 60 | 10 | 3 | 57 | 18 | 3 | 55 | 24 | 1 | 16 | |||
| III | 66 | 2 | 24 | 16 | 3 | 58 | 8 | 5 | 60 | 16 | 2 | 53 | 26 | 1 | 14 | |||
| IV | 14 | 3 | 58 | 8 | 4 | 64 | 12 | 4 | 52 | 29 | 1 | 14 | ||||||
| V | 63 | 2 | 25 | 19 | 5 | 57 | 10 | 4 | 57 | 12 | 3 | 47 | 24 | 1 | 13 | |||
| VI | 9 | 3 | 57 | 63 | 2 | 23 | 16 | 2 | 60 | 12 | 5 | 41 | 17 | 2 | 40 | 41 | 1 | 16 |
© 2021 Open Access. This article is distributed under the terms of the Creative Commons Attribution-ShareAlike 3.0 (CC BY-SA 3.0).